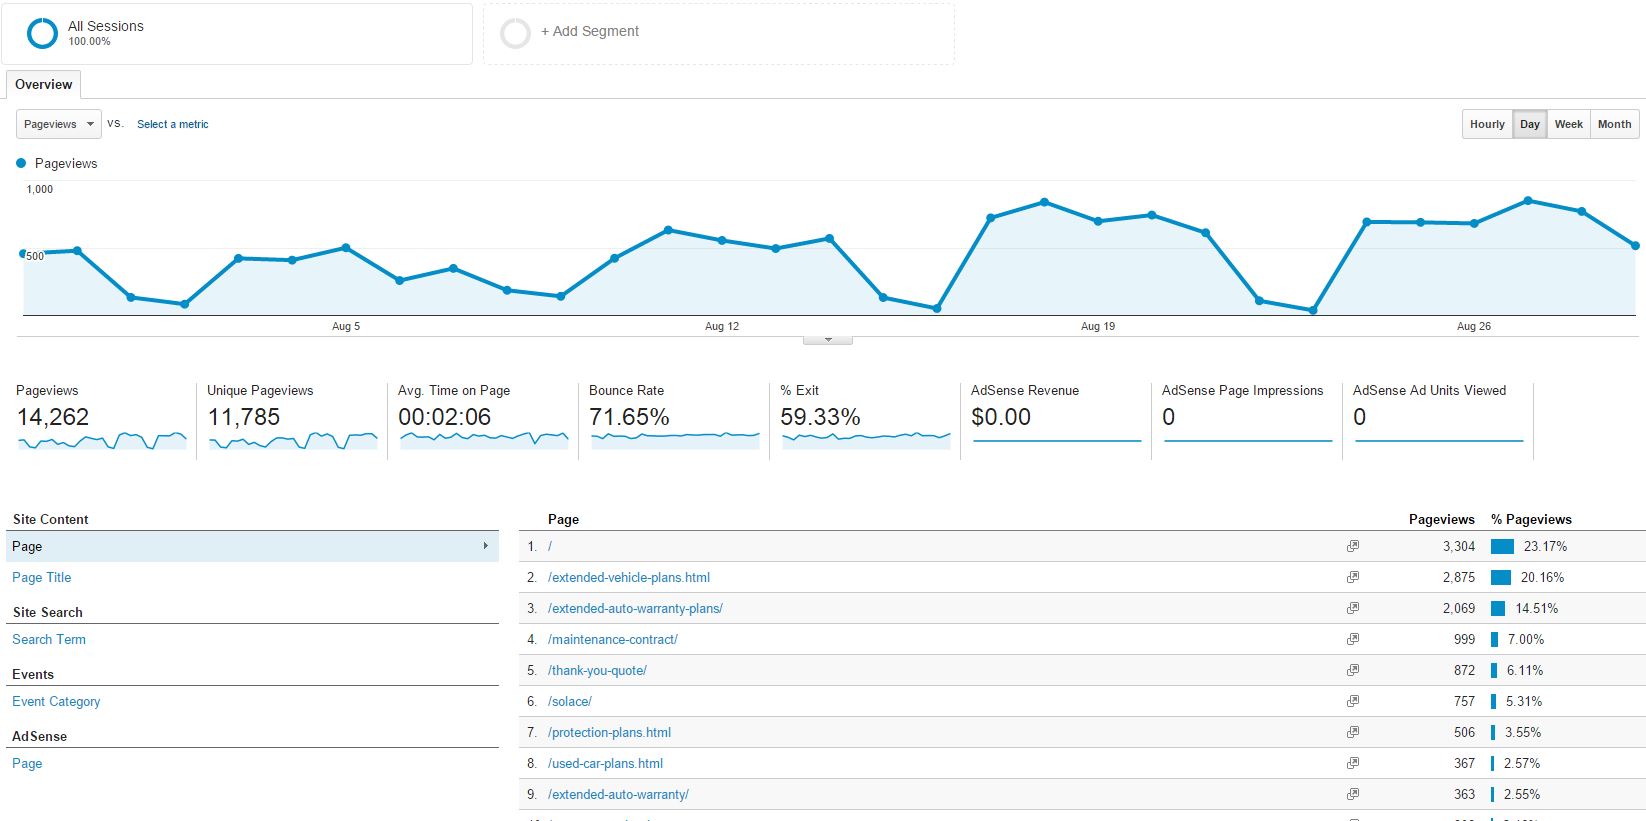
This image is a visualization of the all of the behavior data of a website that I created. The data includes charts, numbers (with charts under them) and a table joined with bar graphs to visualize the percentage of page views. This data is all from Google Analytics. This is data is a from a July 30 to August 29.
Recent Comments