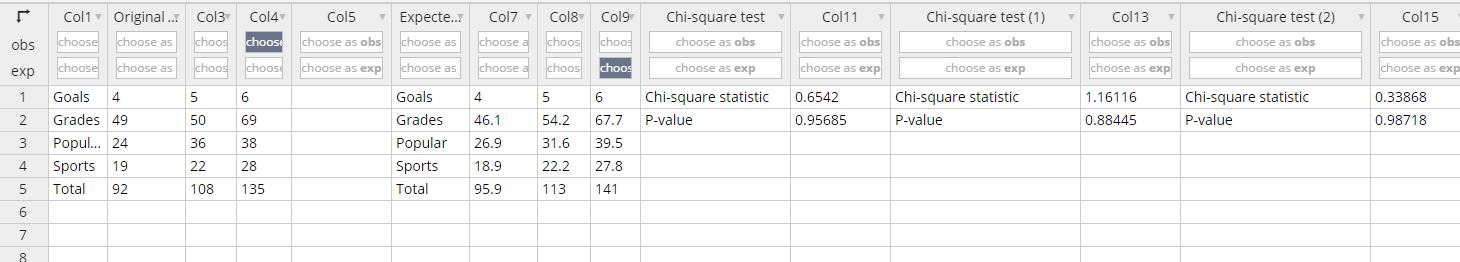
The only thing I struggled with was having to add the totals onto the expected values. Here are the results of the chi square application on the set of data:
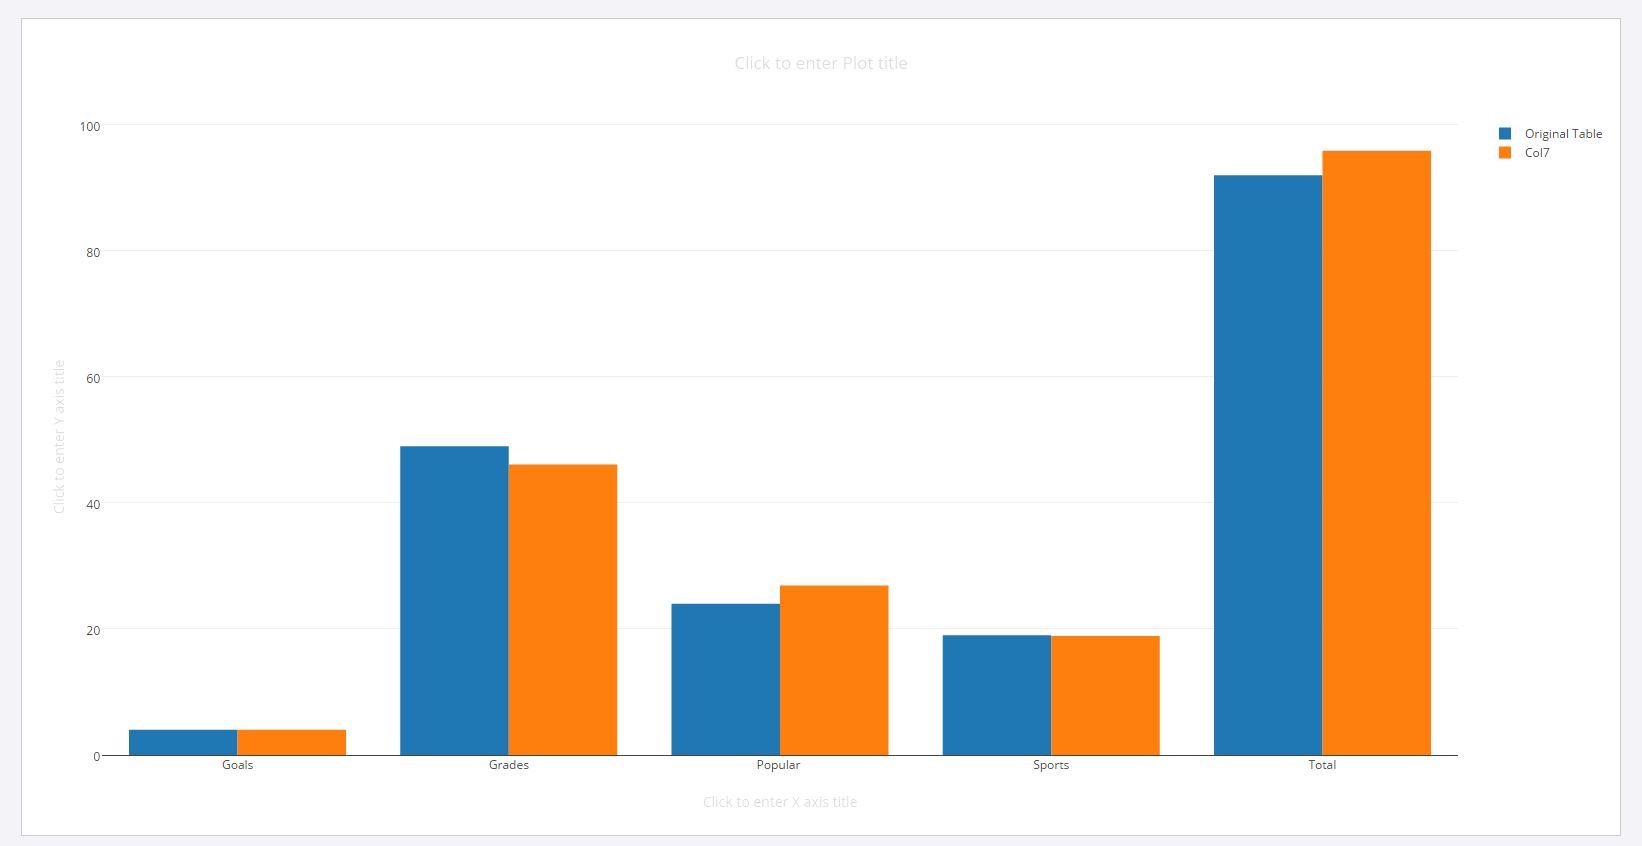
Here is the best fit visualization for comparing the original and expected values:
The only thing I struggled with was having to add the totals onto the expected values. Here are the results of the chi square application on the set of data:
Here is the best fit visualization for comparing the original and expected values: